
[Updated 12 July 2020]
Dear friends I haven't met yet,
What is a life chart? I actually didn't find this term until after I already was keeping track of my own. A life chart is a visual aide in tracking short- and long-term symptoms of something like bipolar disorder. For me, it is a composite of five factors put into a numerical value, and then plotted on a line chart. Other methods include tracking your mood on a detailed scale with notes on things that happened in your day to cause it or notes on major symptom changes. (See the source below for a chart specifically for bipolar disorder.)
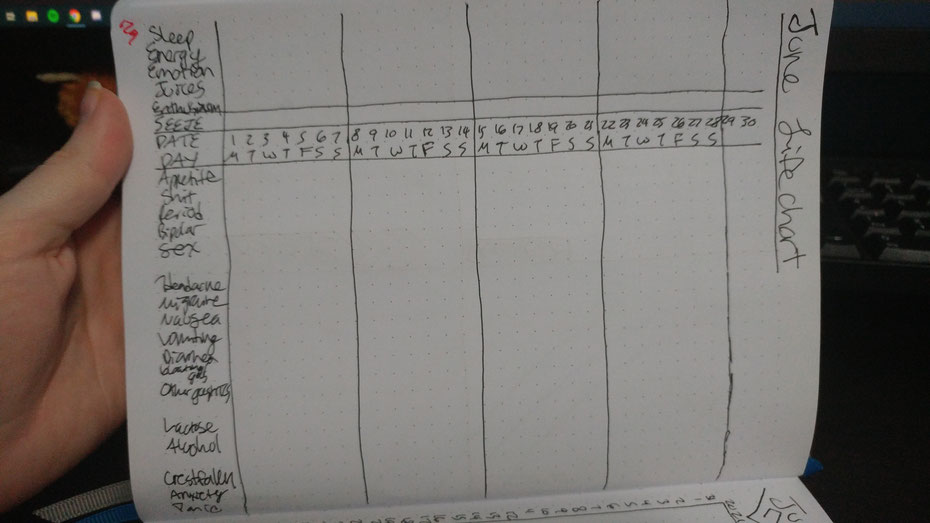
For me, here is what I track:
- Sleep quality
- Energy
- Emotions
- Creative Juices
- Enthusiasm
I then made the scales for each of these as simple as possible. Except for sleep, each of these can have up to three points in it. Sleep quality can go from very bad (1) to very good (5). My energy is either low, middling, or high. My emotions are either negative, neutral, or positive. As for creative juices, either I have barely any or I have a lot, and sometimes I manage to land in between, on days like today. Enthusiasm correlates to how well I take to actually doing my tasks for the day, from chores to classes to writing like this.
There's also a "hidden feature" I can use if I ever need to: the number 0. If I get no sleep. If I'm sick and can't even get out of bed. If my only consumption is liquids. Those are reserved for the worst days; in the sixish months that I've been using this life chart, I haven't had to use a 0 once.
Another important feature is the log. Each time something comes up that's irregular that might affect things, I jot it down on the relevant day. Things like parties, ailments, or unexpected tragedies. These go on a separate page than my lifechart, in my bullet journal system, which you can read more about here.
Every day, I decide on one overall value for last night's sleep and the day's energy, emotions, juices, and enthusiasm. I jot those numbers down as they come up and at the end
of the day I have a total-- mostly between 5 and 15. At the end of the week, I plot each day on a bigger line chart. The horizontal axis is exactly one month long, the vertical axis is the total
SEEJE score for the day. I can see the overall flow of several months this way.
The other part of keeping a lifechart is keeping track of factors you suspect affect your score or health, and ones you know do. I tweak this more often than I tweak what my
score is comprised of (SEEJA when I first wrote this, then SEEJE, and then just SEEE the last time I updated this.) Major things I track include episodes of panic, anxiety, or crestfalleness, my
physical symptoms, and whether I had an average appetite or an abnormal one.
Y'all may want to do a lifechart with different values, and I think you should. Try thinking about what correlates to changes in your life. What causes your bad moods that you might keep track of? What direct or indirect effects are there from your chronic illness? What can you control to make your life better? What can't you control but you CAN recognize? What "side effects" might you have in your life--from medication, diet, or lifestyle? Good or bad, keeping track of your life in such a way as mine can help you recognize what's good for you and what's not. Sometimes we don't like the answers, but they can inform a happier, healthier lifestyle even within strict confines.
For me, I could see how certain situations lead to a better or worse day. I found out that exercise--not intense exercise like running, but something as simple as walking to and from the store--helped improve my mood. I'm also finding out that certain people inspire me to be creative, are muses if you will. I can also see how some of my illnesses, such as chronic headaches, correlate with how I slept or how much stress I'm under.
What I'm reading
- Life Charting for Patients Bipolar Network News
- Determining the Correct Number of Reps Per Set in the Gym by Nerd Fitness
- Sinner by Maggie Stiefvater
- A Field Guide to Getting Lost by Rebecca Solnit
- The Aeronaut's Windlass by Jim Butcher
Write a comment